The Webclient Interface
The webclient interface is an application running in the browser and provides a preview of all Datasets in a specified Dataset Series. It uses an OpenLayers display to show a WMS view of the datasets within a map context. The background map tiles are provided by EOX.
It can further be used to provide a download mechanism for registered datasets.
Enable the Webclient Interface
To enable the webclient interface, several adjustments have to be made to the
instances settings.py and urls.py.
First off, the eoxserver.webclient has to be inserted in the INSTALLED_APPS
option of your settings.py. As the interface also requires several static
files like style-sheets and script files, the option STATIC_URL has to be
set to a path the webserver is able to serve, for example /static/. The
static media files are located under path/to/eoxserver/webclient/static and
can be collected via the collectstatic command.
To finally enable the webclient, a proper URL scheme has to be set up in
urls.py. The following lines would enable the index and the webclient view
on the URL www.yourdomain.com/client.
from django.urls import include, re_path

urlpatterns = [
    ...
    re_path(r'^client/', include('eoxserver.webclient.urls')),
    ...
]
Using the webclient interface
The webclient interface can be accessed via the given URL in urls.py as described in the instructions above, whereas the URL www.yourdomain.com/client wouldopen an index view, displaying links to the webclient for every dataset series registered in the system. To view the webclient for a specific dataset series, use this URL: www.yourdomain.com/client/<EOID> where <EOID> is the EO-ID of the dataset series you want to inspect.
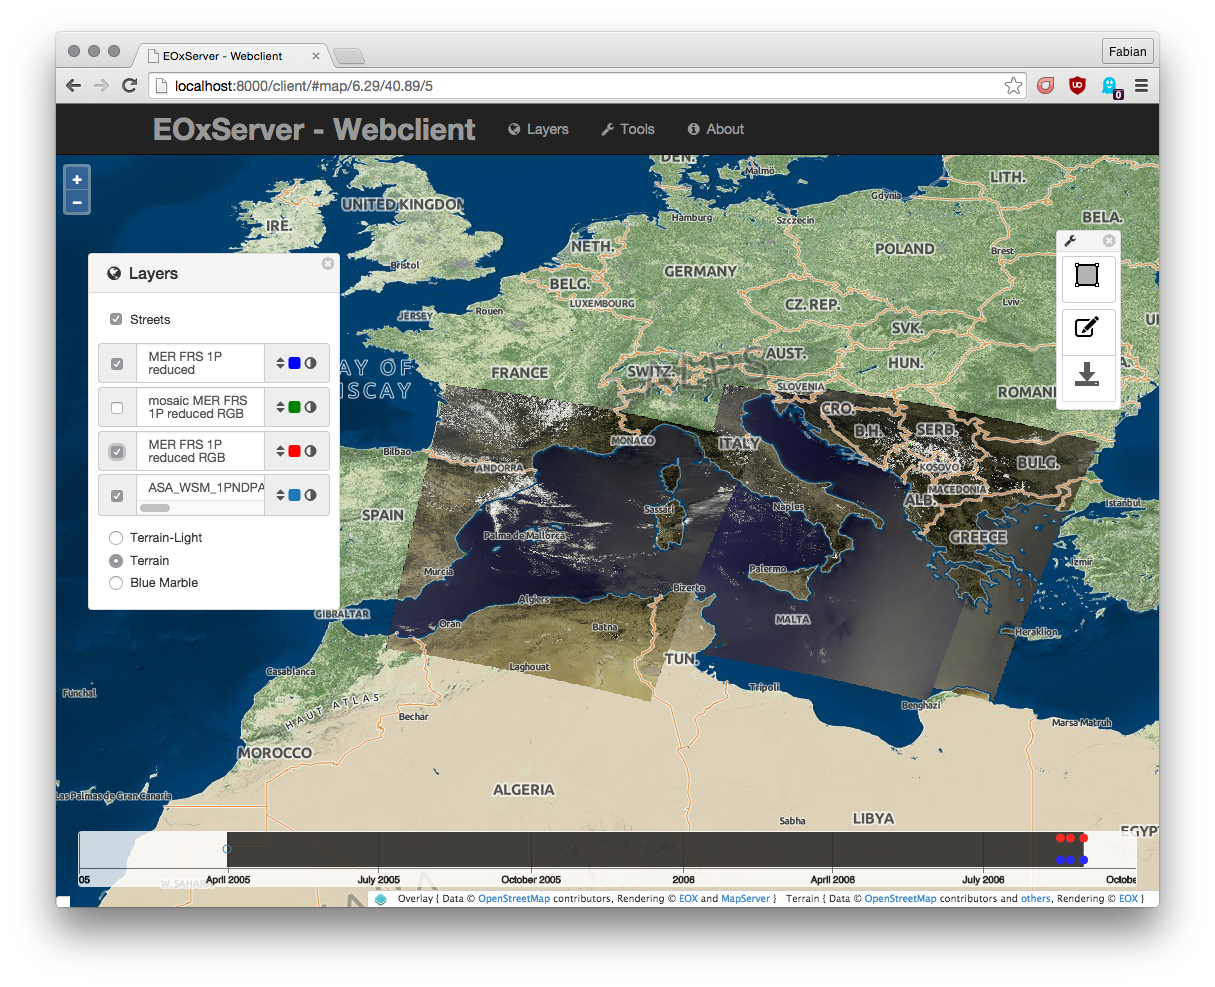
The webclient showing the contents of the autotest instance.
The map can be panned with via mouse dragging or the map-moving buttons in the upper left of the screen. Alternatively, the arrow keys can be used. The zoomlevel can be adjusted with the mouse scrolling wheel or the zoom-level buttons located directly below the pan control buttons.
A click on the small “+” sign on the upper right of the screen reveals the layer switcher control, where the preview and outline layers of the dataset series can be switched on or off.
The upper menu allows to switch the visibility of the “Layers”, “Tools” and
“About” panels. The “Layers” panel allows to set the visibility of all the
enabled layers of the instance. This includes all non-empty collections and all
coverages that are visible but not in a collection. Also the background and
the overlay can be altered.
The “Tools” panel allows to draw bounding boxes, manage selections and trigger the download. In order to download, first at least one bounding box must be drawn. Afterwards the download icon is clickable.
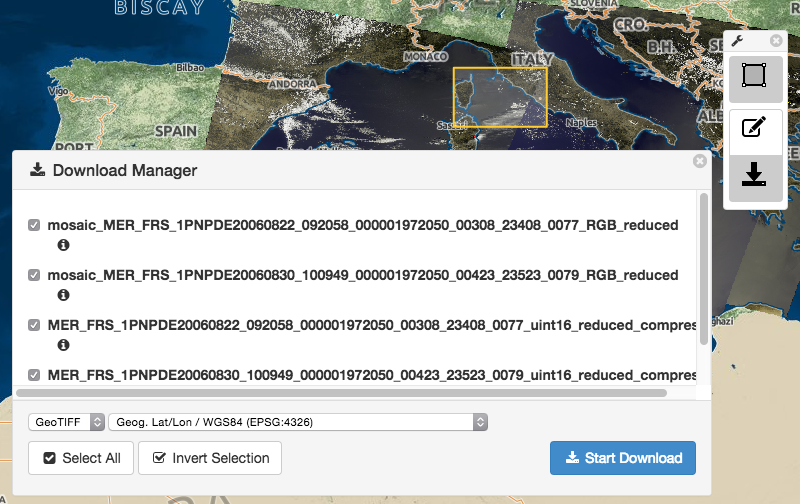
The download selection view.
Upon clicking on the download icon, the download view is shown. It displays all the coverages available for download that are in the active layers and are intersecting with the spatio-temporal subsets. There, additional download options can be made:
actually selecting coverages for download
selecting an output format
selecting an output projection
When all coverages to be downloaded are selected and all configuration is done a click on “Start Download” triggers the download of each coverage, subcetted by the given spatial subsets.
The “About” panel shows general info of EOxClient, the software used to build the webclient.
In the bottom there is the timeslider widget. It is only shown if at least one layer is active. Like the map, it is “zoomable” (use the mousewheel when the mouse is over the timeslider) and “pannable” (the bar that contains the actual dates and times is the handle). It also allows to draw time intervals by dragging over the upper half of the widget. The upper half is also where coverages are displayed as colored dots or lines. The color of the dots/lines is the same as the color of its associated collection, whereas only active collections are visible on the timeslider. Hollow dots/lines mean that the coverage is currently not in the maps viewport. By clicking on a dot/line the map zooms to the coverages extent.